


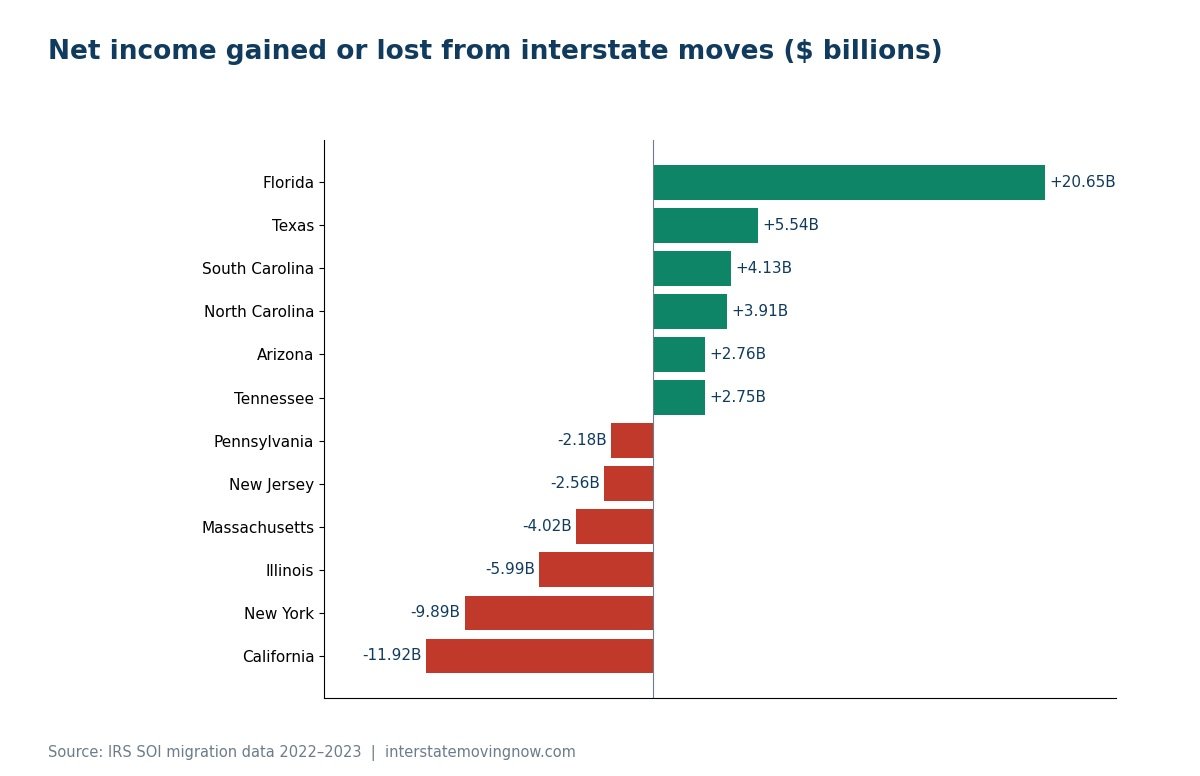
Quick answer: Florida gained more income from interstate movers than any other state in the latest IRS data: a net $20.65 billion in adjusted gross income, more than Texas, South Carolina, North Carolina, Arizona and Tennessee combined. California lost the most, a net $11.92 billion, followed by New York at $9.89 billion and Illinois at $5.99 billion.
Most migration rankings count people. This report counts money. The IRS Statistics of Income division matches federal tax returns filed in consecutive years and records when a filer’s address changes states, along with the income on those returns. We analyzed the latest release, the IRS SOI state-to-state migration data for 2022–2023, which tracks households whose address changed between the 2022 and 2023 filing seasons.
Last updated: October 23, 2026
Key findings
- Florida gained a net $20.65 billion in income from domestic movers, more than the next five gaining states combined ($19.09 billion).
- Households moving into Florida reported $123,000 in average AGI, against $76,000 for those leaving: the widest gap of any state, at $46,000.
- Texas gained the most households (a net 56,473 returns) but far less income than Florida (a net $5.54 billion), because its newcomers earn about the same as those who leave.
- California lost a net $11.92 billion and 100,397 returns, the most of any state on both measures; New York lost $9.89 billion.
- The wave is cooling: Florida’s net gain fell 43% from $35.99 billion in the 2021–2022 data, and California’s net loss halved from $23.79 billion.
- The single largest income corridor was New York to Florida, carrying $5.75 billion in AGI across 43,187 returns.
Which states gained the most income from movers?
The Southeast and Sun Belt took almost all of the net gain. The table ranks states by net AGI, which is income on returns moving in minus income on returns moving out, from the IRS state inflow and outflow files.
| Rank | State | Net AGI gained | Net returns | Avg AGI, movers in | Avg AGI, movers out |
|---|---|---|---|---|---|
| 1 | Florida | $20.65B | +55,349 | $123K | $76K |
| 2 | Texas | $5.54B | +56,473 | $84K | $80K |
| 3 | South Carolina | $4.13B | +29,214 | $88K | $67K |
| 4 | North Carolina | $3.91B | +39,118 | $80K | $74K |
| 5 | Arizona | $2.76B | +17,316 | $87K | $76K |
| 6 | Tennessee | $2.75B | +24,104 | $79K | $70K |
| 7 | Nevada | $1.51B | +8,977 | $87K | $75K |
| 8 | Idaho | $0.99B | +5,811 | $81K | $64K |
| 9 | New Hampshire | $0.76B | +2,168 | $109K | $88K |
| 10 | Georgia | $0.75B | +14,671 | $70K | $72K |
New Hampshire stands out: it gained only 2,168 returns on net, but the households arriving reported $109,000 in average income. Georgia is the opposite case. It gained 14,671 returns, yet newcomers earned slightly less than the people leaving, so its income gain was small.
Which states lost the most income to other states?
The losses are concentrated in large, high-cost states in the Northeast, Midwest and on the West Coast. Here are the ten largest net AGI losses in the same IRS data.
| Rank | State | Net AGI lost | Net returns | Avg AGI, movers in | Avg AGI, movers out |
|---|---|---|---|---|---|
| 1 | California | −$11.92B | −100,397 | $96K | $102K |
| 2 | New York | −$9.89B | −71,987 | $94K | $106K |
| 3 | Illinois | −$5.99B | −28,609 | $79K | $104K |
| 4 | Massachusetts | −$4.02B | −15,378 | $90K | $117K |
| 5 | New Jersey | −$2.56B | −19,370 | $102K | $107K |
| 6 | Pennsylvania | −$2.18B | −12,095 | $76K | $86K |
| 7 | Maryland | −$1.82B | −13,628 | $81K | $88K |
| 8 | Ohio | −$1.63B | −7,994 | $67K | $78K |
| 9 | Minnesota | −$1.47B | −5,106 | $70K | $89K |
| 10 | Michigan | −$0.96B | −8,770 | $74K | $78K |
Illinois and Massachusetts lose more income than their household counts suggest. In both, departing households reported $26,000 to $27,000 more in average AGI than arriving ones. Washington is a quieter case: it gained 9,839 returns on net but still lost $0.27 billion in income, because those leaving averaged $100,000 against $90,000 for those arriving.
Which moving corridors carry the most income?
Ranked by AGI, the busiest state-to-state flows run from the Northeast and California toward Florida, Texas and neighboring states. These are one-way flows from the IRS outflow file, not net figures.
| Corridor | AGI moved | Returns | Avg AGI per return |
|---|---|---|---|
| New York → Florida | $5.75B | 43,187 | $133K |
| New York → New Jersey | $5.11B | 43,699 | $117K |
| California → Texas | $4.76B | 44,417 | $107K |
| Illinois → Florida | $3.31B | 14,834 | $223K |
| New Jersey → Florida | $2.96B | 20,113 | $147K |
| California → Washington | $2.75B | 24,625 | $112K |
| California → Nevada | $2.69B | 26,210 | $103K |
| California → Florida | $2.64B | 20,241 | $130K |
| Massachusetts → Florida | $2.54B | 12,159 | $209K |
Two corridors show how concentrated the income is. Illinois to Florida moved fewer than 15,000 returns but $3.31 billion, an average of $223,000 per return. Massachusetts to Florida averaged $209,000. Those averages are pulled up by a small number of very high earners, which is typical of retirement and wealth moves to no-income-tax states. Costs for several of these routes are in our reports on moving from New York to Florida, California to Texas and Illinois to Florida.
Is income migration slowing down?
Yes, sharply. Comparing the latest file with the previous IRS release for 2021–2022 shows the pandemic-era wave cooling on both ends. Florida’s net income gain fell by 43%, and California’s net loss shrank by half.
| State | Net AGI, 2021–2022 | Net AGI, 2022–2023 | Change |
|---|---|---|---|
| Florida | +$35.99B | +$20.65B | −43% |
| Texas | +$10.14B | +$5.54B | −45% |
| Tennessee | +$4.65B | +$2.75B | −41% |
| South Carolina | +$4.76B | +$4.13B | −13% |
| California | −$23.79B | −$11.92B | Loss down 50% |
| New York | −$14.16B | −$9.89B | Loss down 30% |
| Illinois | −$9.84B | −$5.99B | Loss down 39% |
| Massachusetts | −$3.87B | −$4.02B | Loss up 4% |
Two states moved against the trend. South Carolina kept most of its gain, slipping only 13%, which makes it the steadiest winner in the data. Massachusetts is the only large losing state whose income drain grew. The direction of migration has not changed, though: the same states gain and lose in both years. Higher mortgage rates since 2022 are one likely reason the volume dropped, as our mortgage rate lock-in report explains.
Our analysis: why do people and income move differently?
Comparing household counts with income shows two different kinds of migration. Texas, North Carolina and Georgia are gaining working households at roughly the income level of the people they lose. That points to job-driven, cost-of-living moves. Florida, South Carolina, New Hampshire and Idaho attract households with noticeably higher incomes than the people leaving, which fits moves driven by retirement, remote work and state income taxes. Florida, Texas, Tennessee, Nevada, New Hampshire (on wages) and South Dakota all appear among the income gainers and have no broad state income tax on wages; our no-income-tax states report looks at that pull directly.
For a mover, the practical reading is simple. The corridors that carry the most income are also the busiest and most competitive moving routes, which affects price and scheduling. Book early on routes into Florida and the Carolinas, especially in the spring and summer peak.
Methodology and sources
All figures come from the IRS Statistics of Income state-to-state migration files for 2022–2023 (stateinflow2223 and stateoutflow2223). The IRS counts a migration when the state on a filer’s return changes between filing years 2022 and 2023. “Returns” approximate households, and “people” are exemptions claimed. AGI is reported in thousands of dollars. We used the “Total Migration-US” rows for each state, which exclude foreign moves, and calculated net AGI, net returns and average AGI per return ourselves. Limitations: the data covers only people who filed returns in both years, so it misses many retirees with low taxable income, students and non-filers, and it lags by about three years. Rounding means sums may differ slightly.
FAQ
Which state gains the most income from people moving in?
Florida, by a wide margin. IRS migration data for 2022–2023 shows a net gain of $20.65 billion in adjusted gross income from households moving in from other states.
Which state loses the most income to migration?
California lost a net $11.92 billion in AGI and about 100,000 tax returns to other states in the 2022–2023 IRS data. New York was second, at $9.89 billion.
Where does the IRS migration data come from?
The IRS Statistics of Income division compares addresses on individual tax returns filed in consecutive years. When the state changes, it records the move, the number of returns and exemptions, and the adjusted gross income.
Why does Texas gain more people than Florida but less income?
Households moving to Texas earn about the same as those leaving it ($84,000 vs. $80,000 average AGI). Households moving to Florida earn far more than those leaving ($123,000 vs. $76,000), so each Florida arrival adds more income.
Planning a move along one of these routes? Start with our interstate moving cost calculator.








No Comments